Keyword ins/outs
Simplified the MVP. Magnified the results
How I refined an MVP to save months of work for the devs, 9 hours of CS time a week, and increased the unique value of our product... all without a fancy UI.
Context
STAT Search Analytics
STAT allows users to track data for thousands of keywords and then updates that data daily.
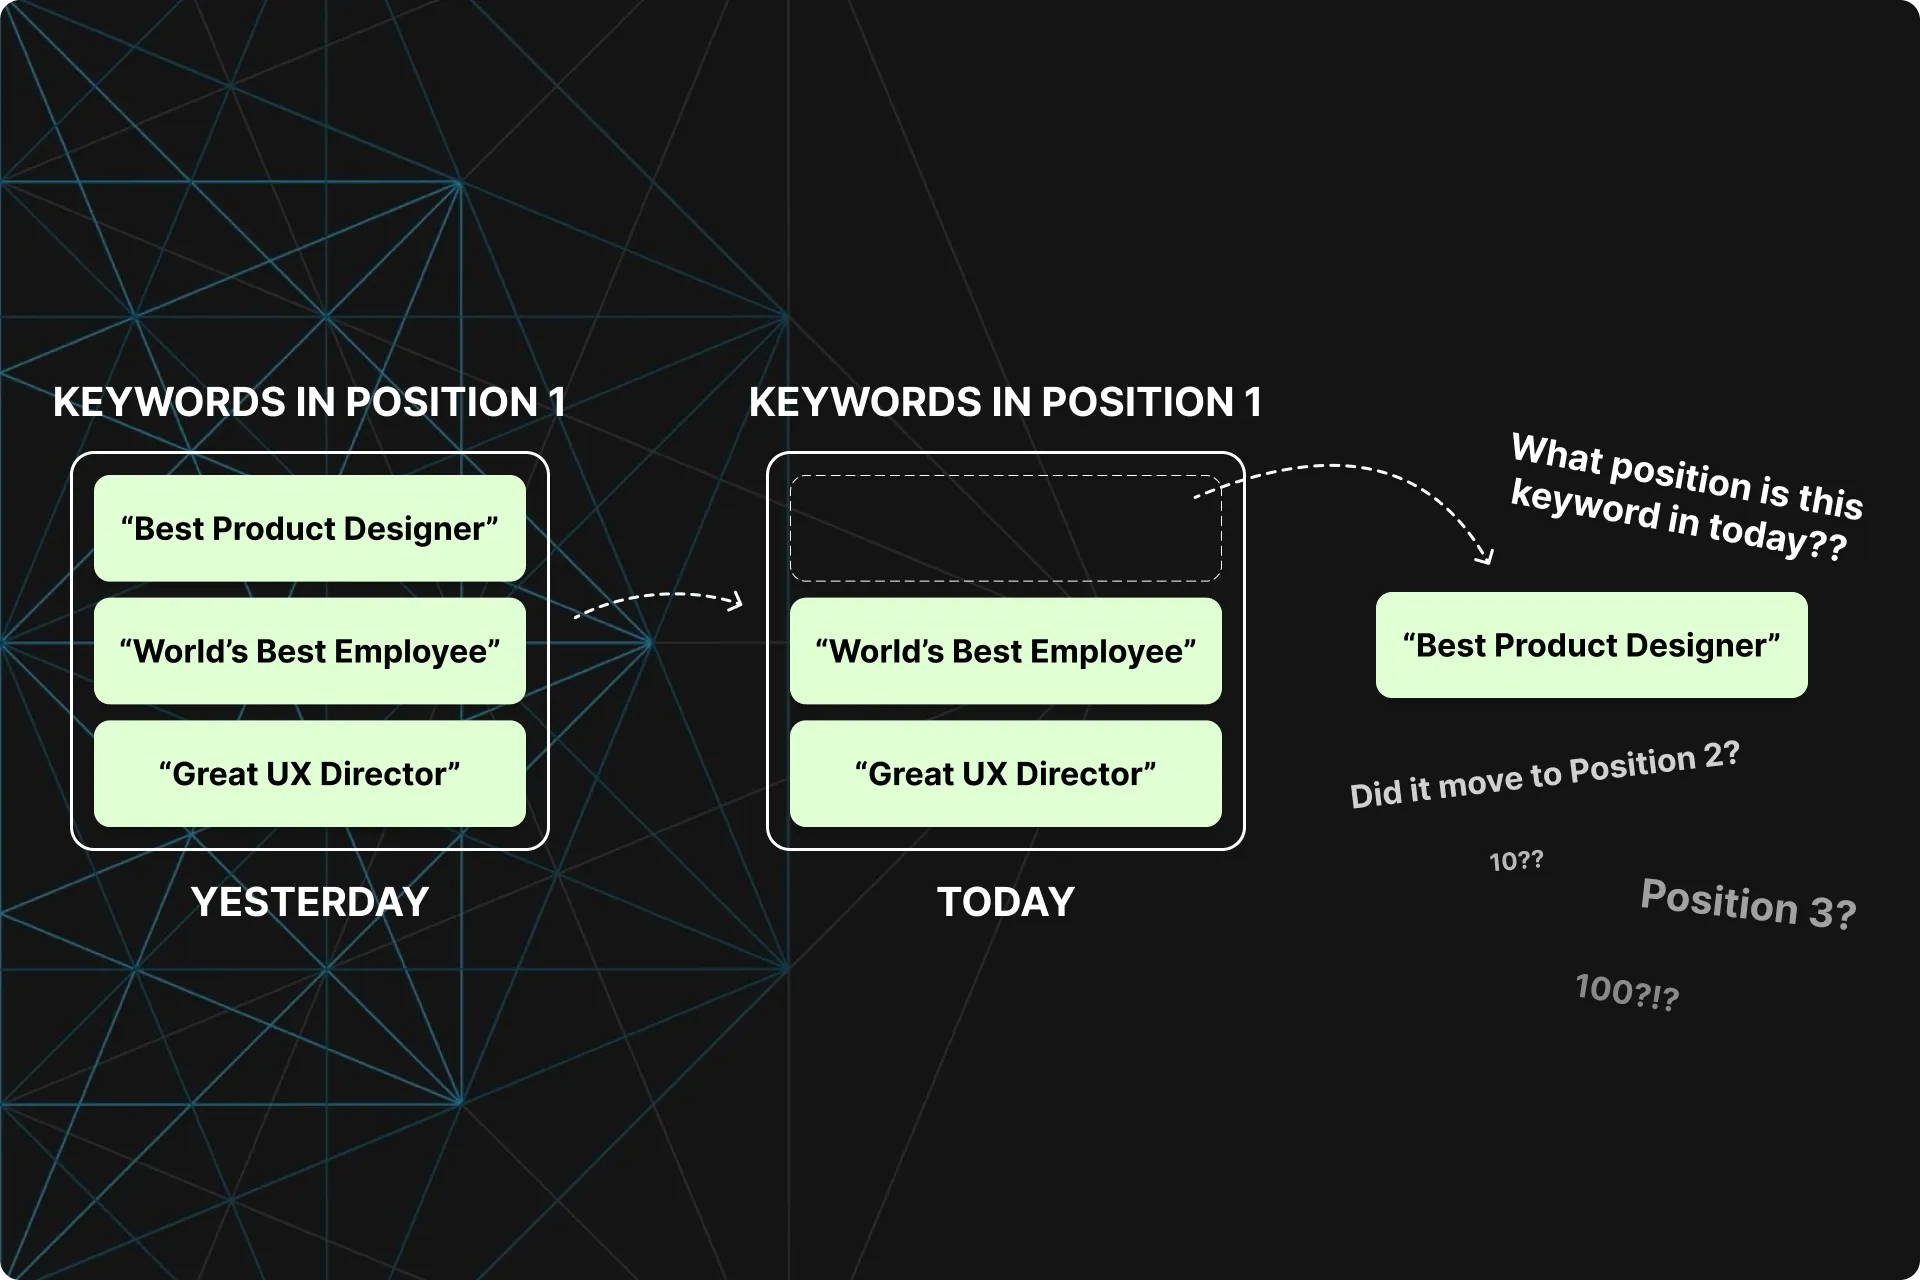
Keywords are grouped into “Tags” based on their ranking, and the user can easily see what keywords are in a tag for Position 1, or Position 2, or 3, etc...
However, when a Keyword leaves the Position 1 tag, STAT didn’t tell them what position tag it moved to.
ProblemS
Our clients wanted to know what tag their keywords were going to when they changed rankings.
For example, when they have 50 keywords in position 3 on Monday, and only 40 in position 3 on Tuesday, where did those 10 go? What keywords were they, and what position are they in now?
This was a recurring piece of unsolicited feedback throughout our research projects.
Goals
Create a way for our users to easily see where their keywords are moving to and from.
This should:
- Increase customer satisfaction and retention
- Increase engagement in our app
- Increase adoption of our app
- Reduce support burden
- Provide unique value compared to our competitors
- Have a new feature fleshed out and validated for the dev team to pick up when they need work
Step 01
Dug into the business impact
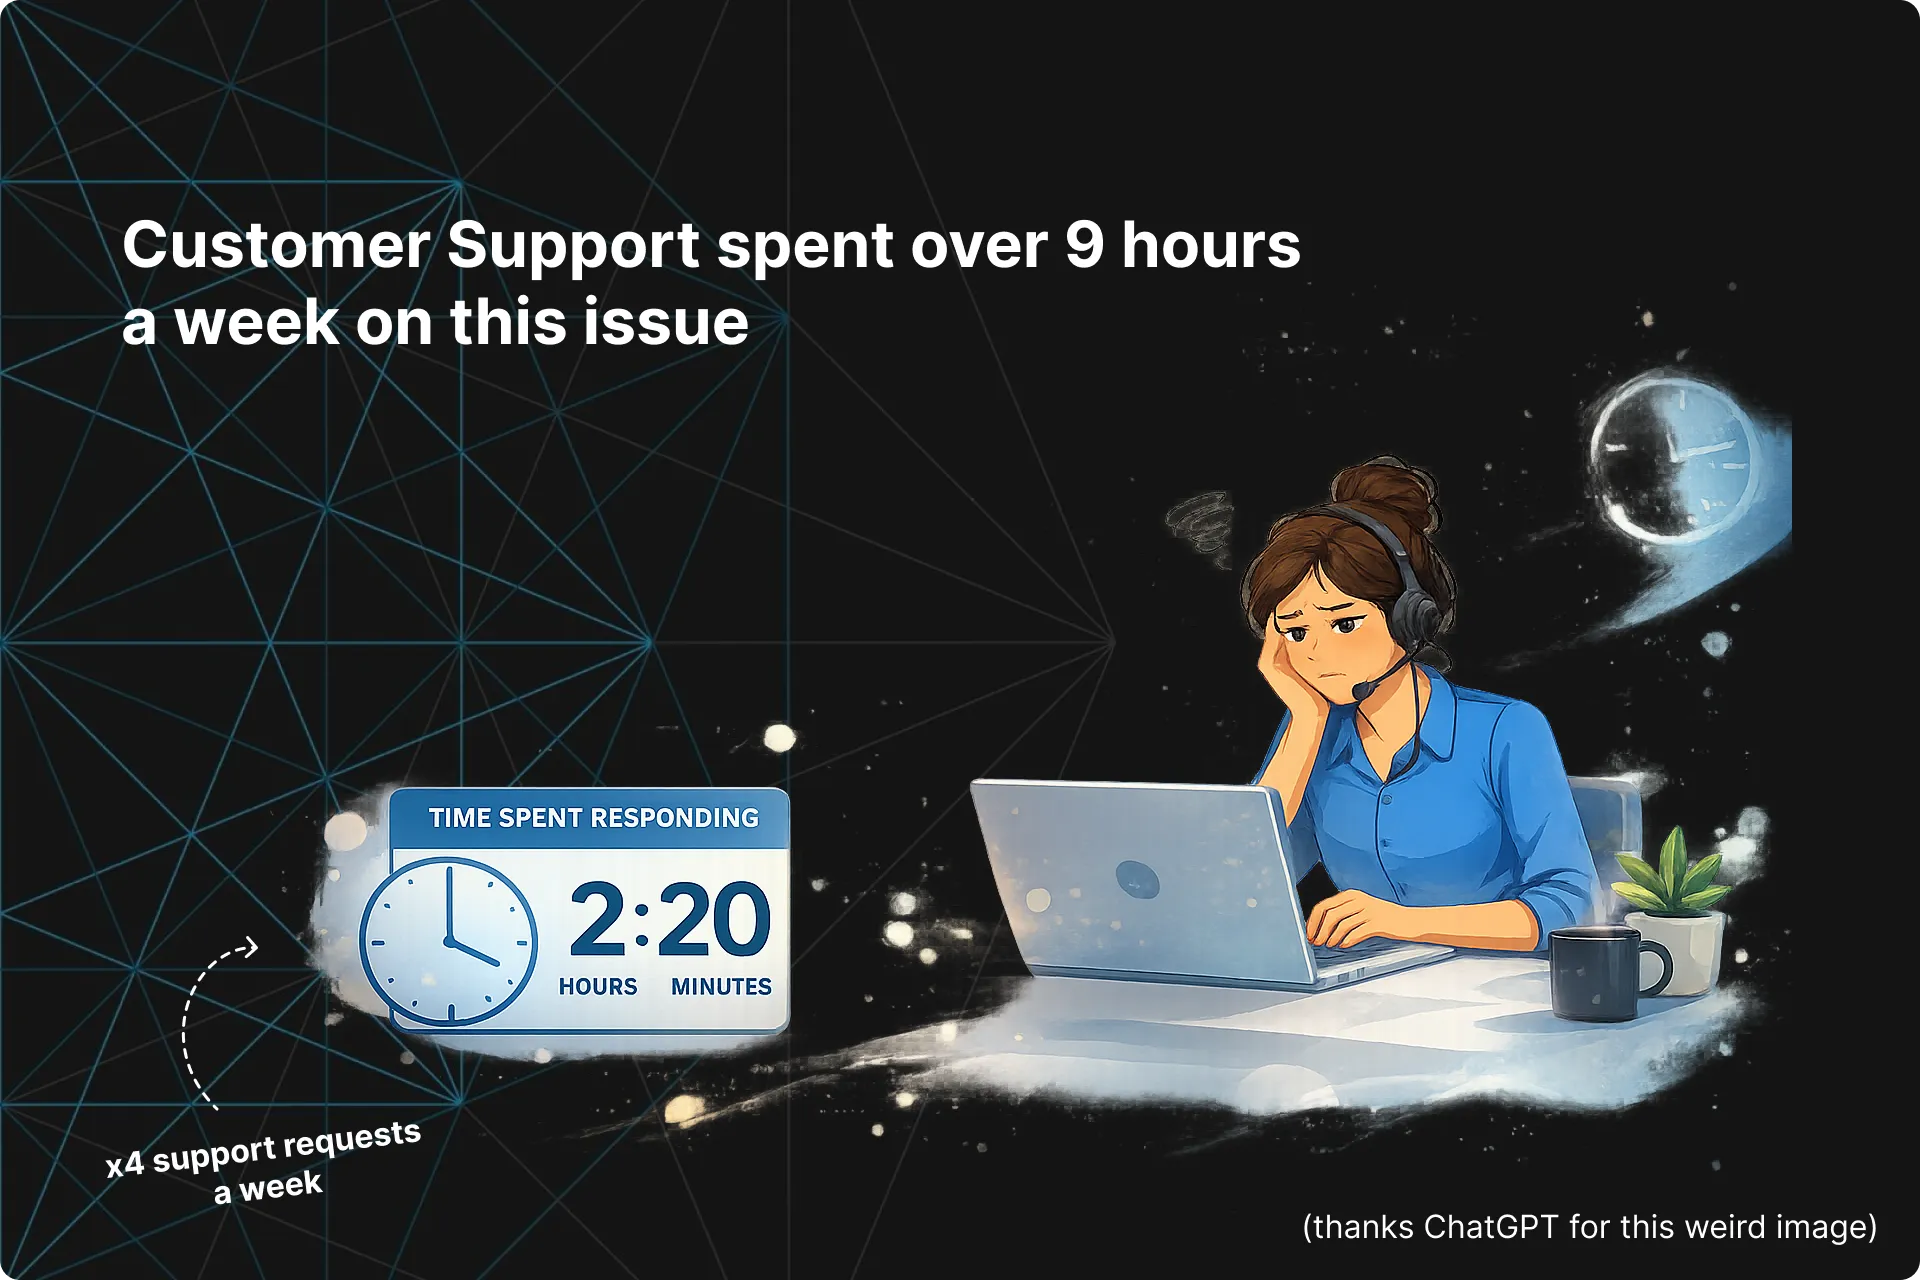
This piece of feedback resonated well with our CS department who claimed they spend too much time figuring this out for our clients.
From a quick dig into their support ticket system and asking CS a few questions, I found:
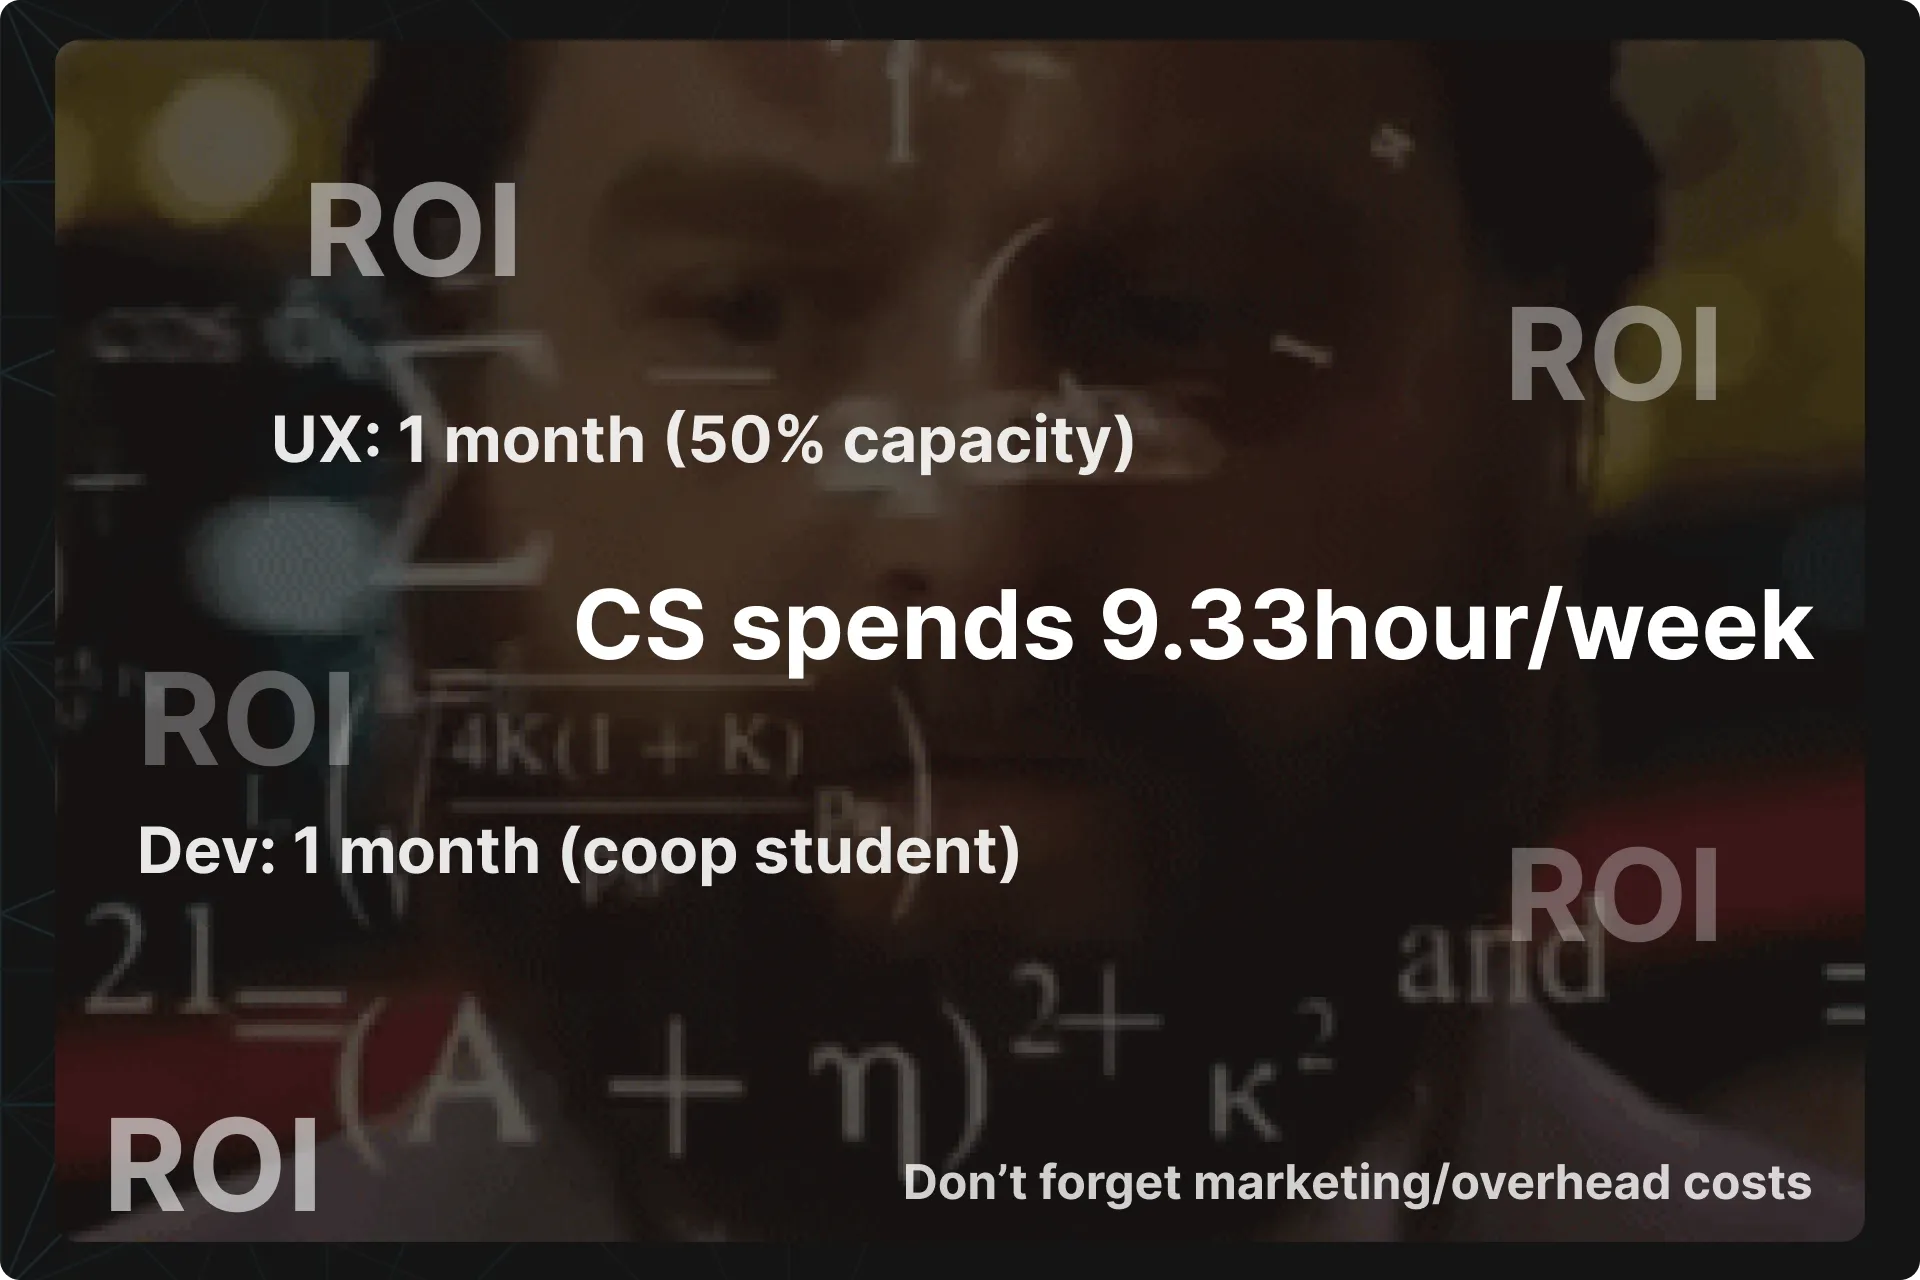
- CS spends about 2 hours each time there’s an inquiry about this, as they have to figure out this information manually. Plus they need time to respond to inquiries. Total time is on average 2h20 minutes.
- These inquiries come in around 4x a week. That’s more than a day a week spent on this.
This information will add to the ROI calculation later on, but was enough for us to warrant exploring this further.
Step 02
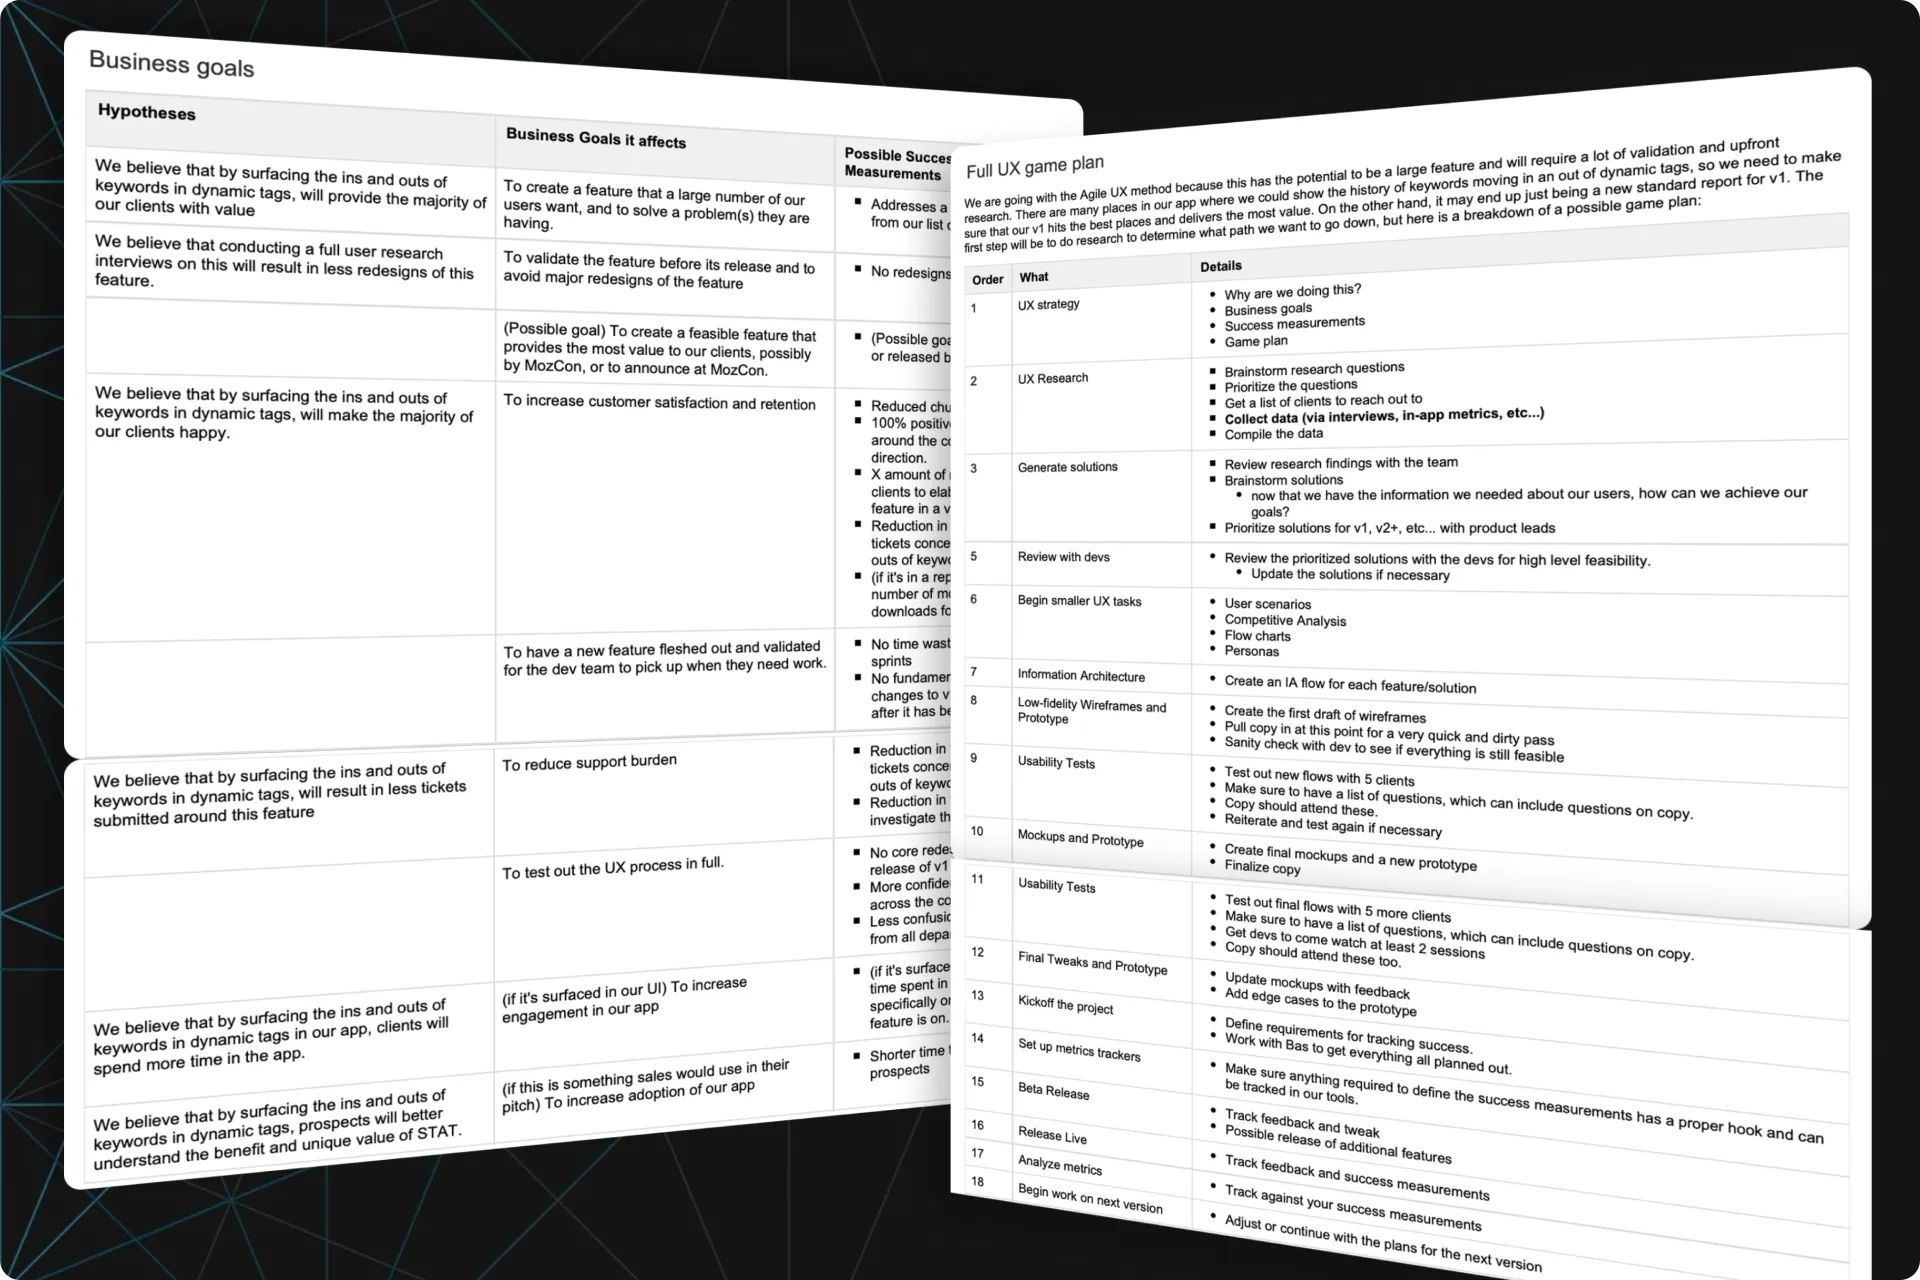
Formalized the project and plan
I like to approach every project with a formalized plan, regardless if it’s a lean approach or not. This plan comes out of a discovery session with the stakeholders and ties our user goals, business goals, hypotheses and constraints all together so we can tailor the right strategy for it.
It also helps align different departments on the work that needs to be done, and gives everyone more understanding as to why we are doing this.
I formalized everything and reviewed this with the VP of Product who then signed off on it. This meant we could start plugging away at our plan.
Step 03
URQBS (erk-you-biss)
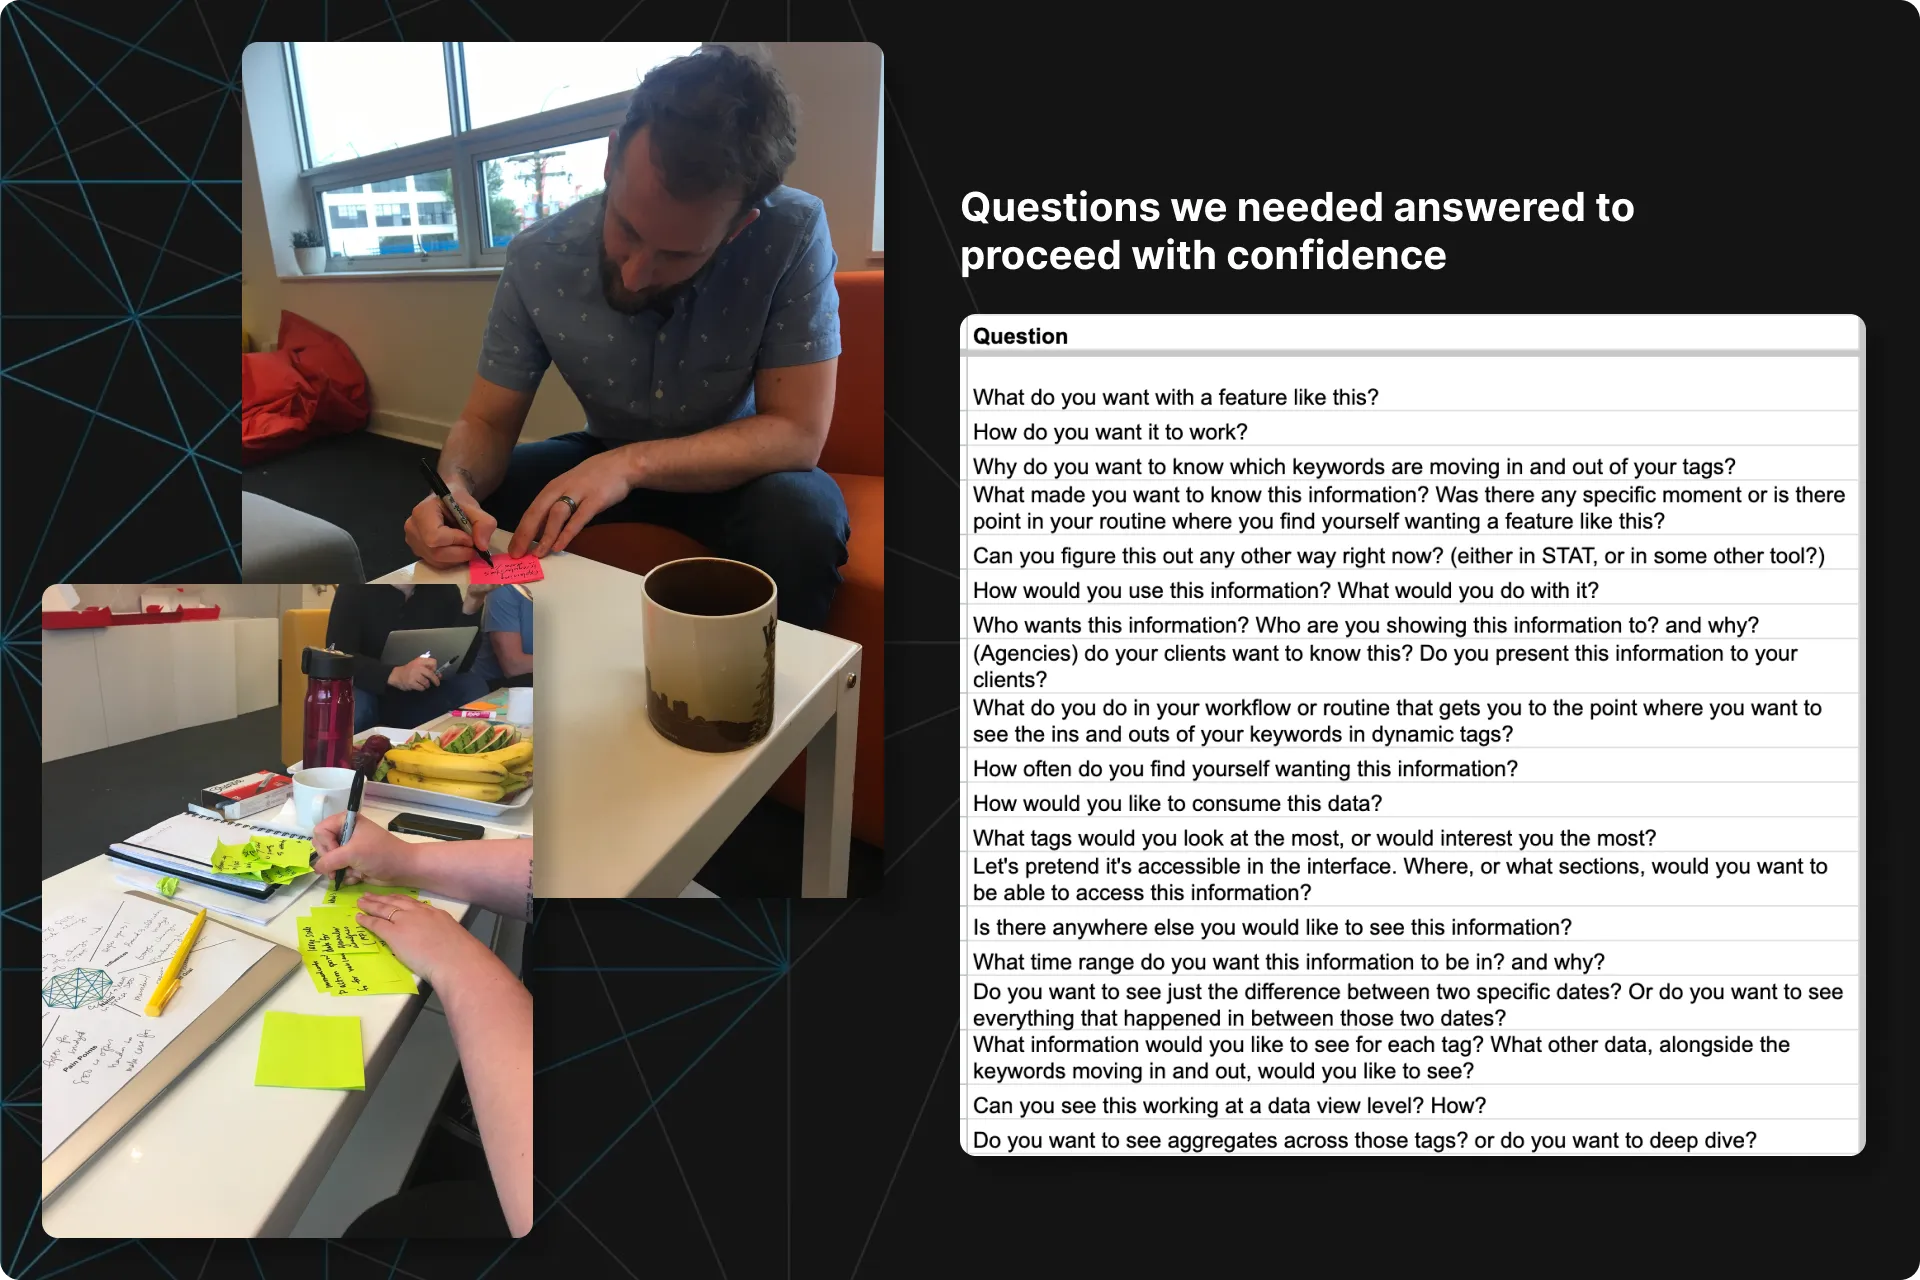
To build confidence in this feature, I needed to know what questions everyone had so I could get them some answers.
I conducted a User Research Question Brainstorming Session (popularly known as an URQBS) with a few people that were going to be working on it; a few devs, CS members and the product owner.
Not only does this method generate great questions, it gets everyone invested at the start.We then edited and prioritized them, then determined the best way to get the answers (ex: some required research interviews, others required data pulls, etc…).
The goal was to figure out what we could answer in a reasonable amount of time, and how. The more we can answer, the more confidence we can have going forward.
Step 04
Conducted various research methods
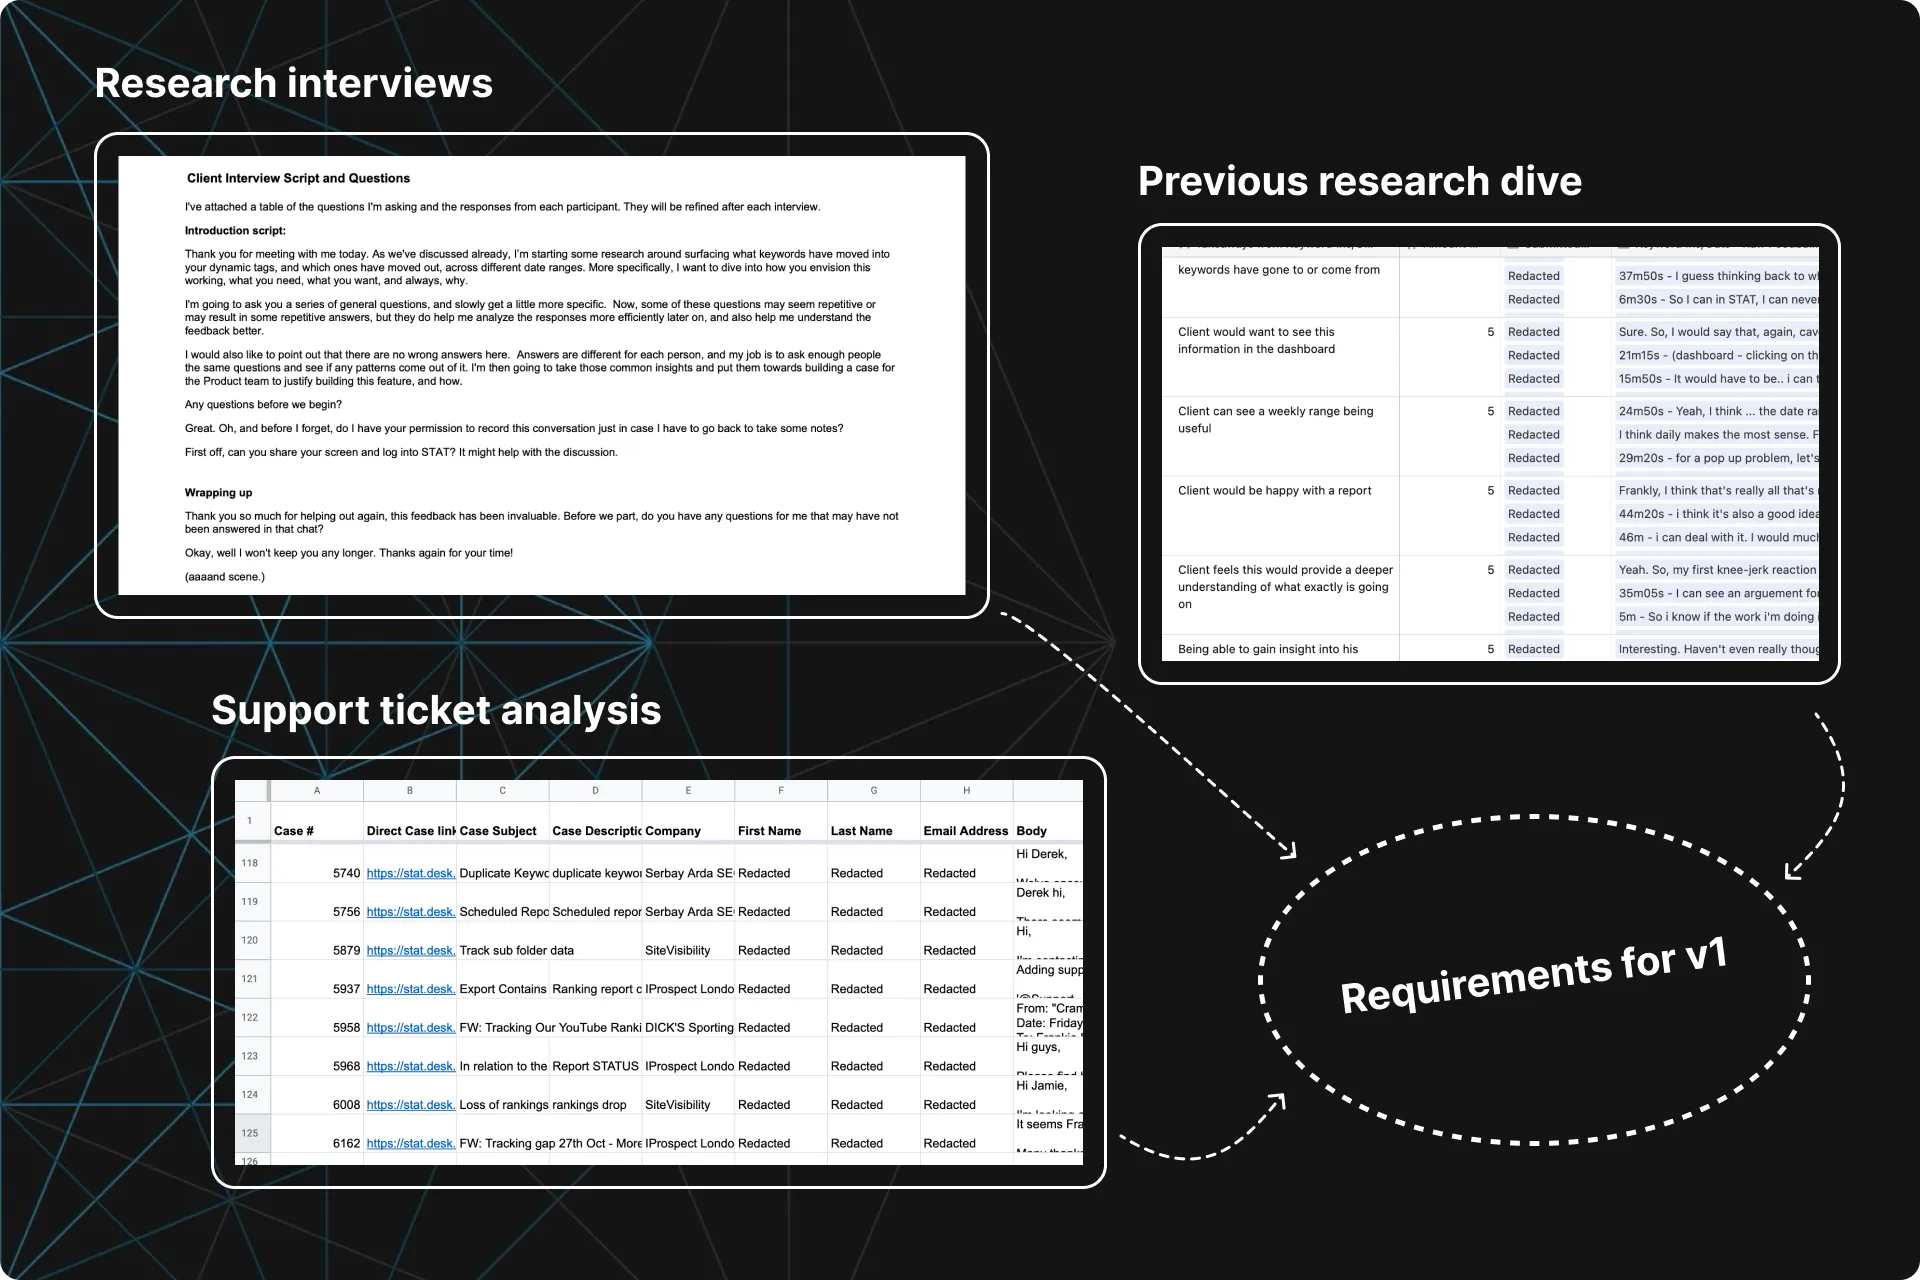
From there, I conducted Research Interviews and did a deeper dive into our support system to see what exactly was being said.
What I learned:
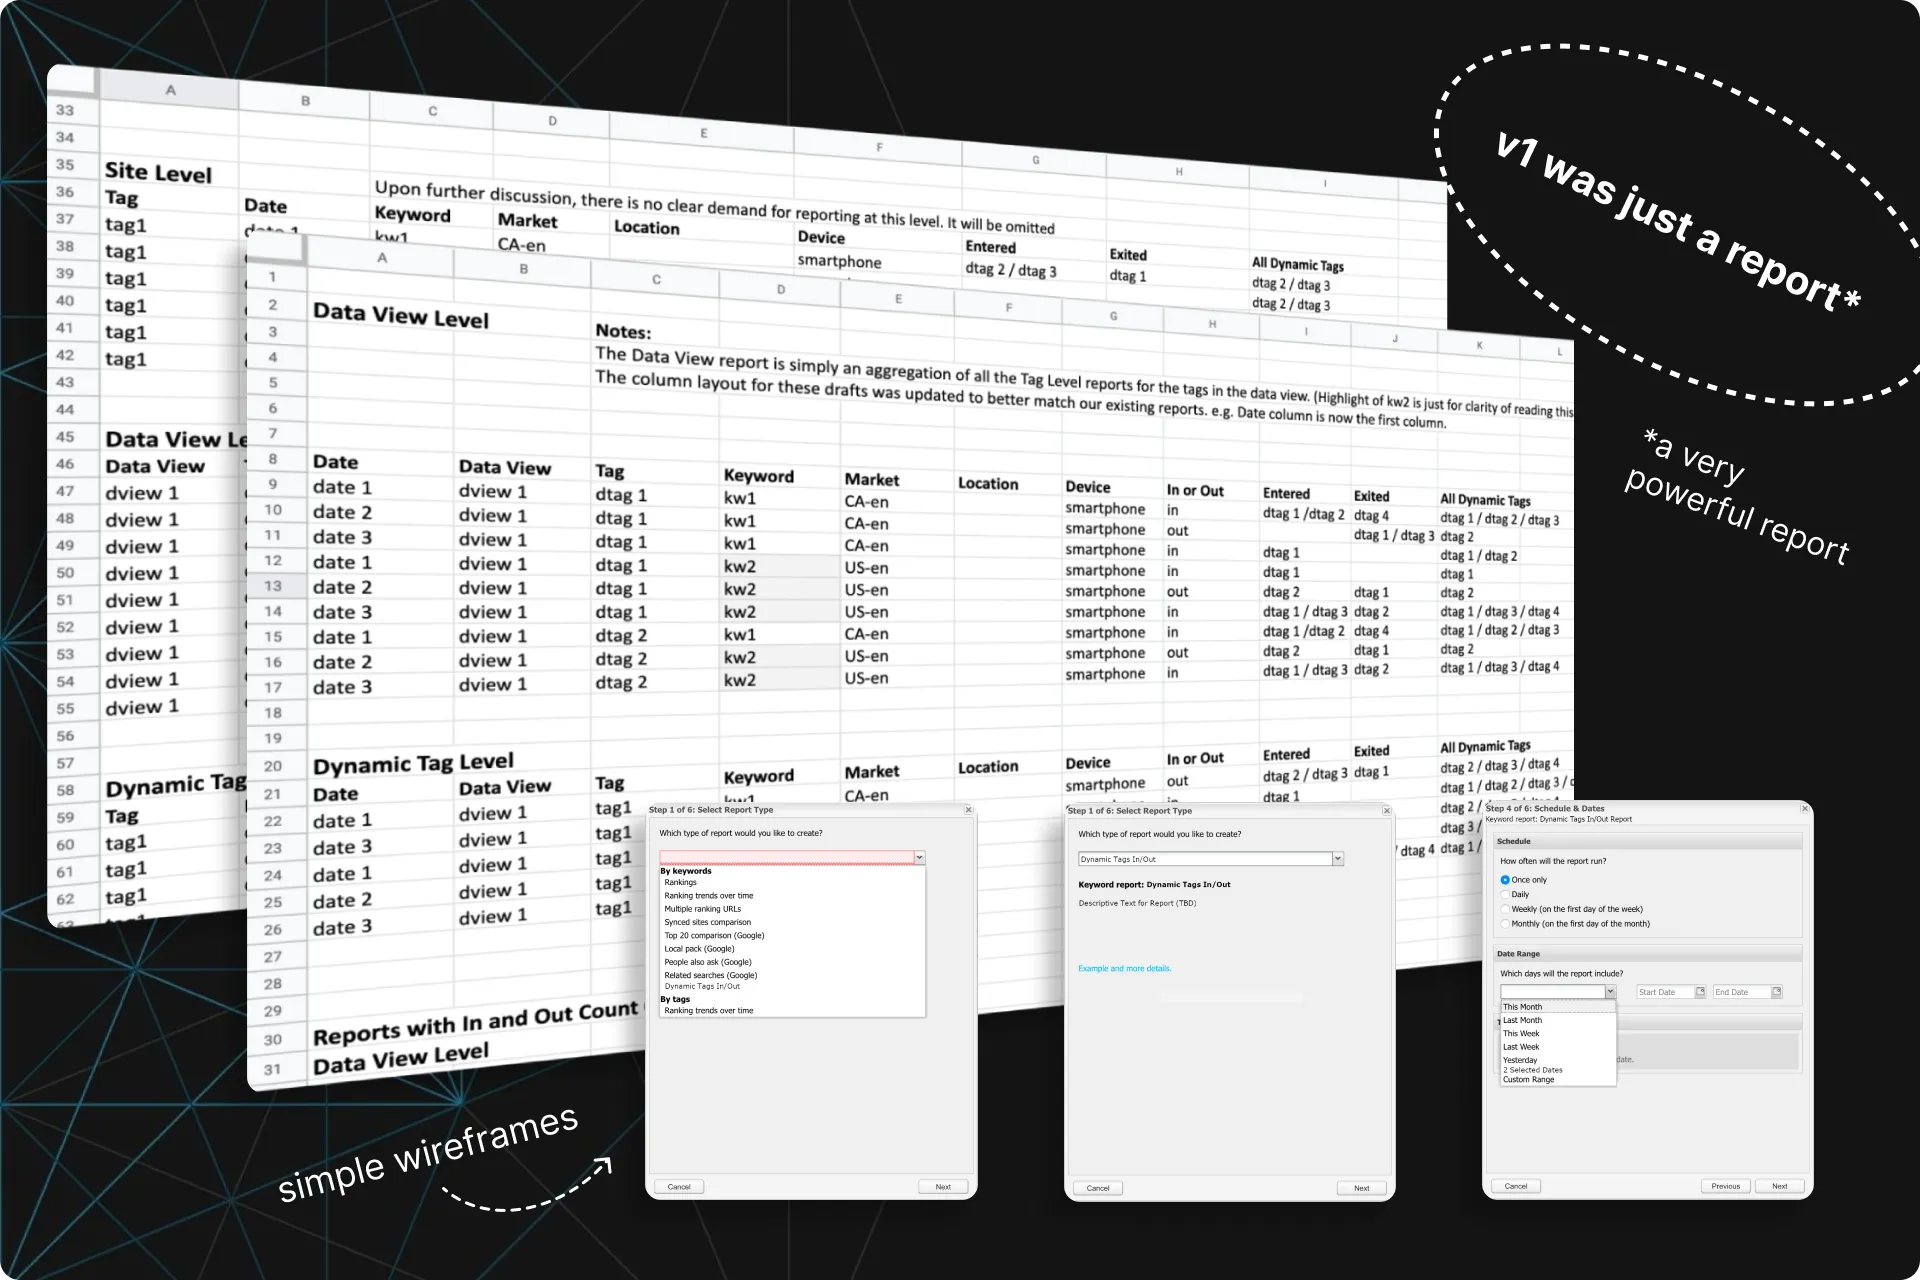
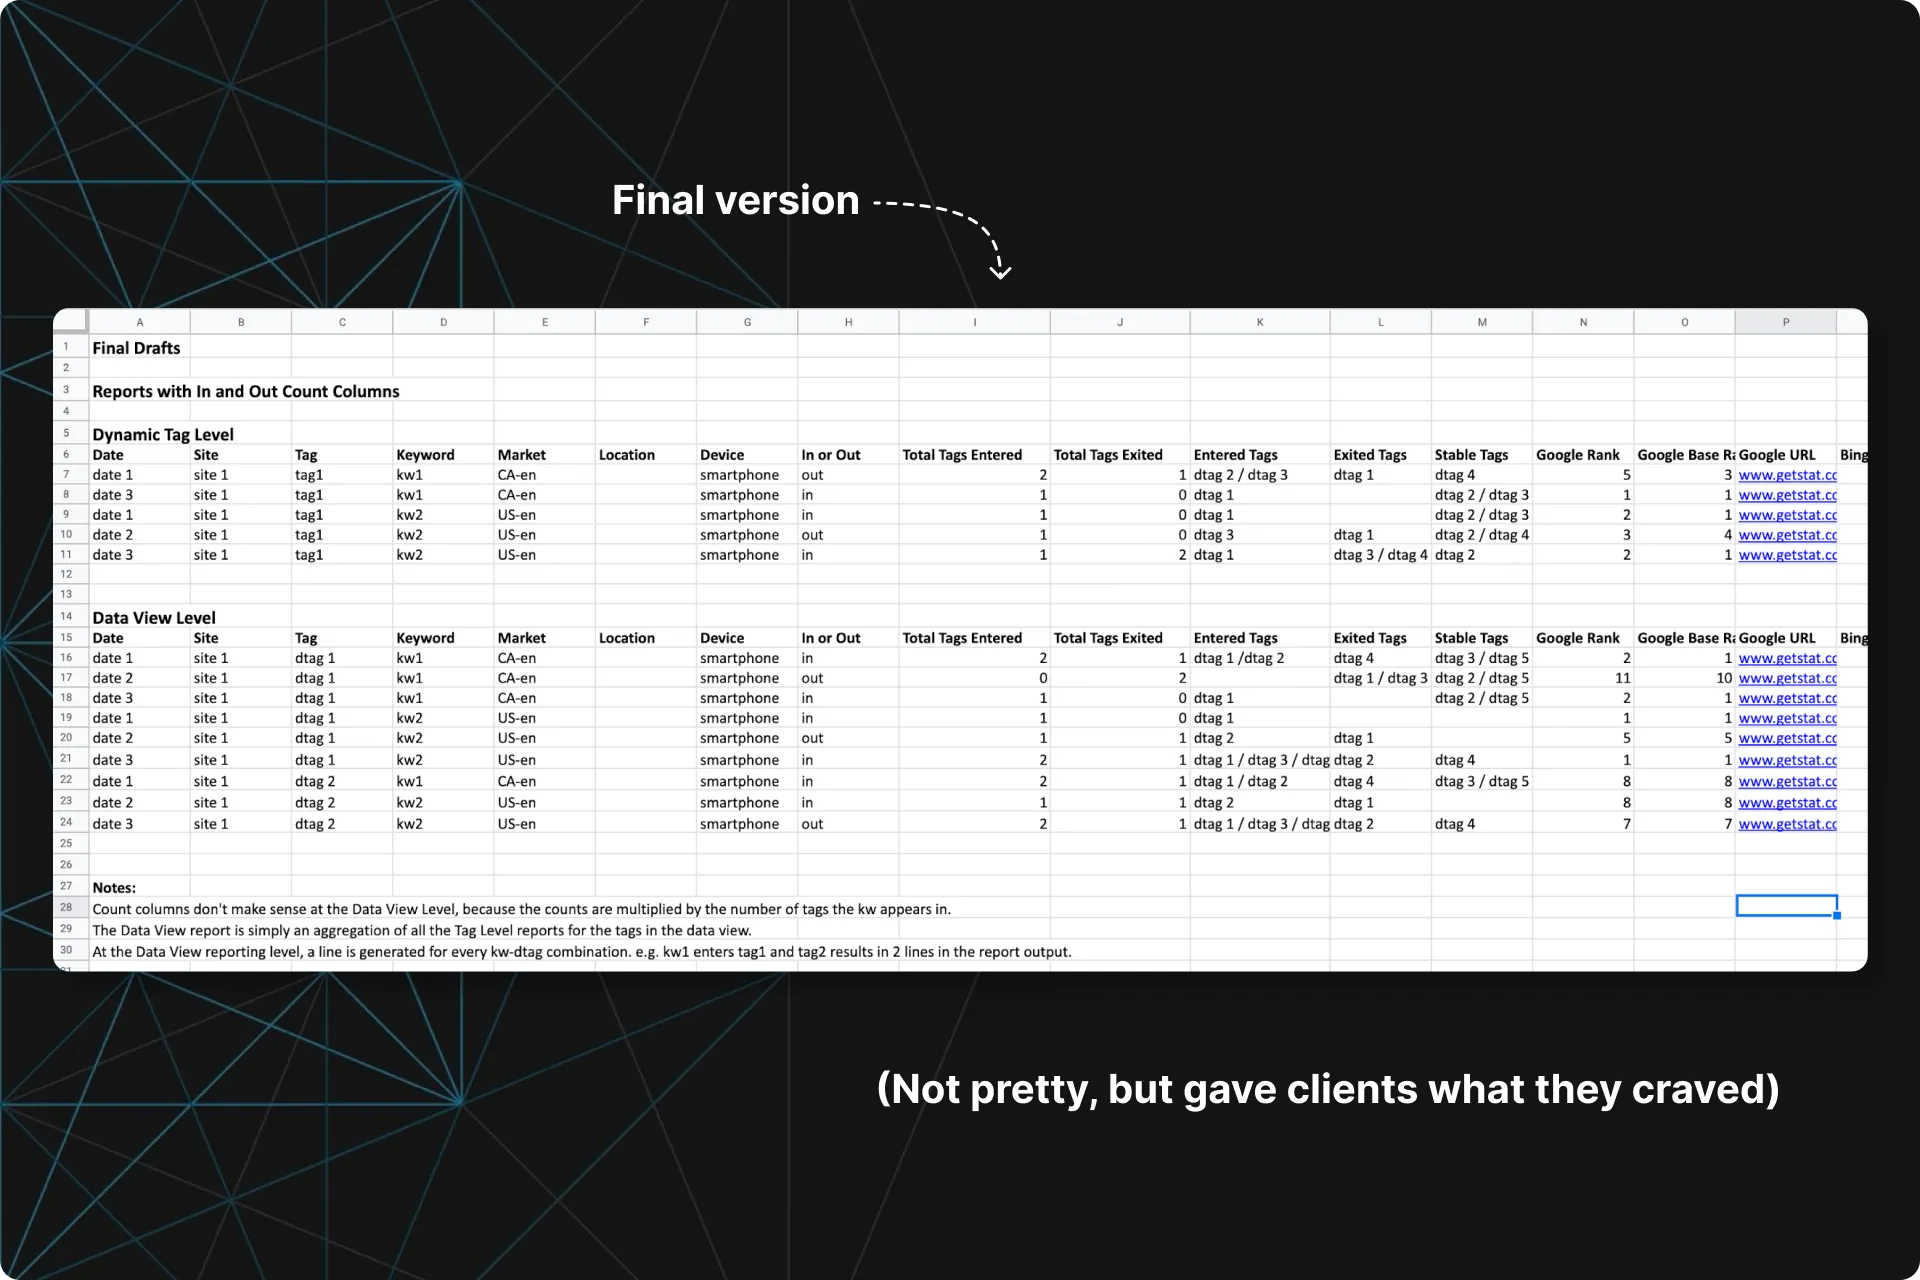
One big takeaway was that even though our participants wanted to see this in an interactive dashboard, they would still be happy if this information was only available in a report.
From this, and the rest of the takeaways, we were able to create a list of requirements for v1 of this feature.
Step 05
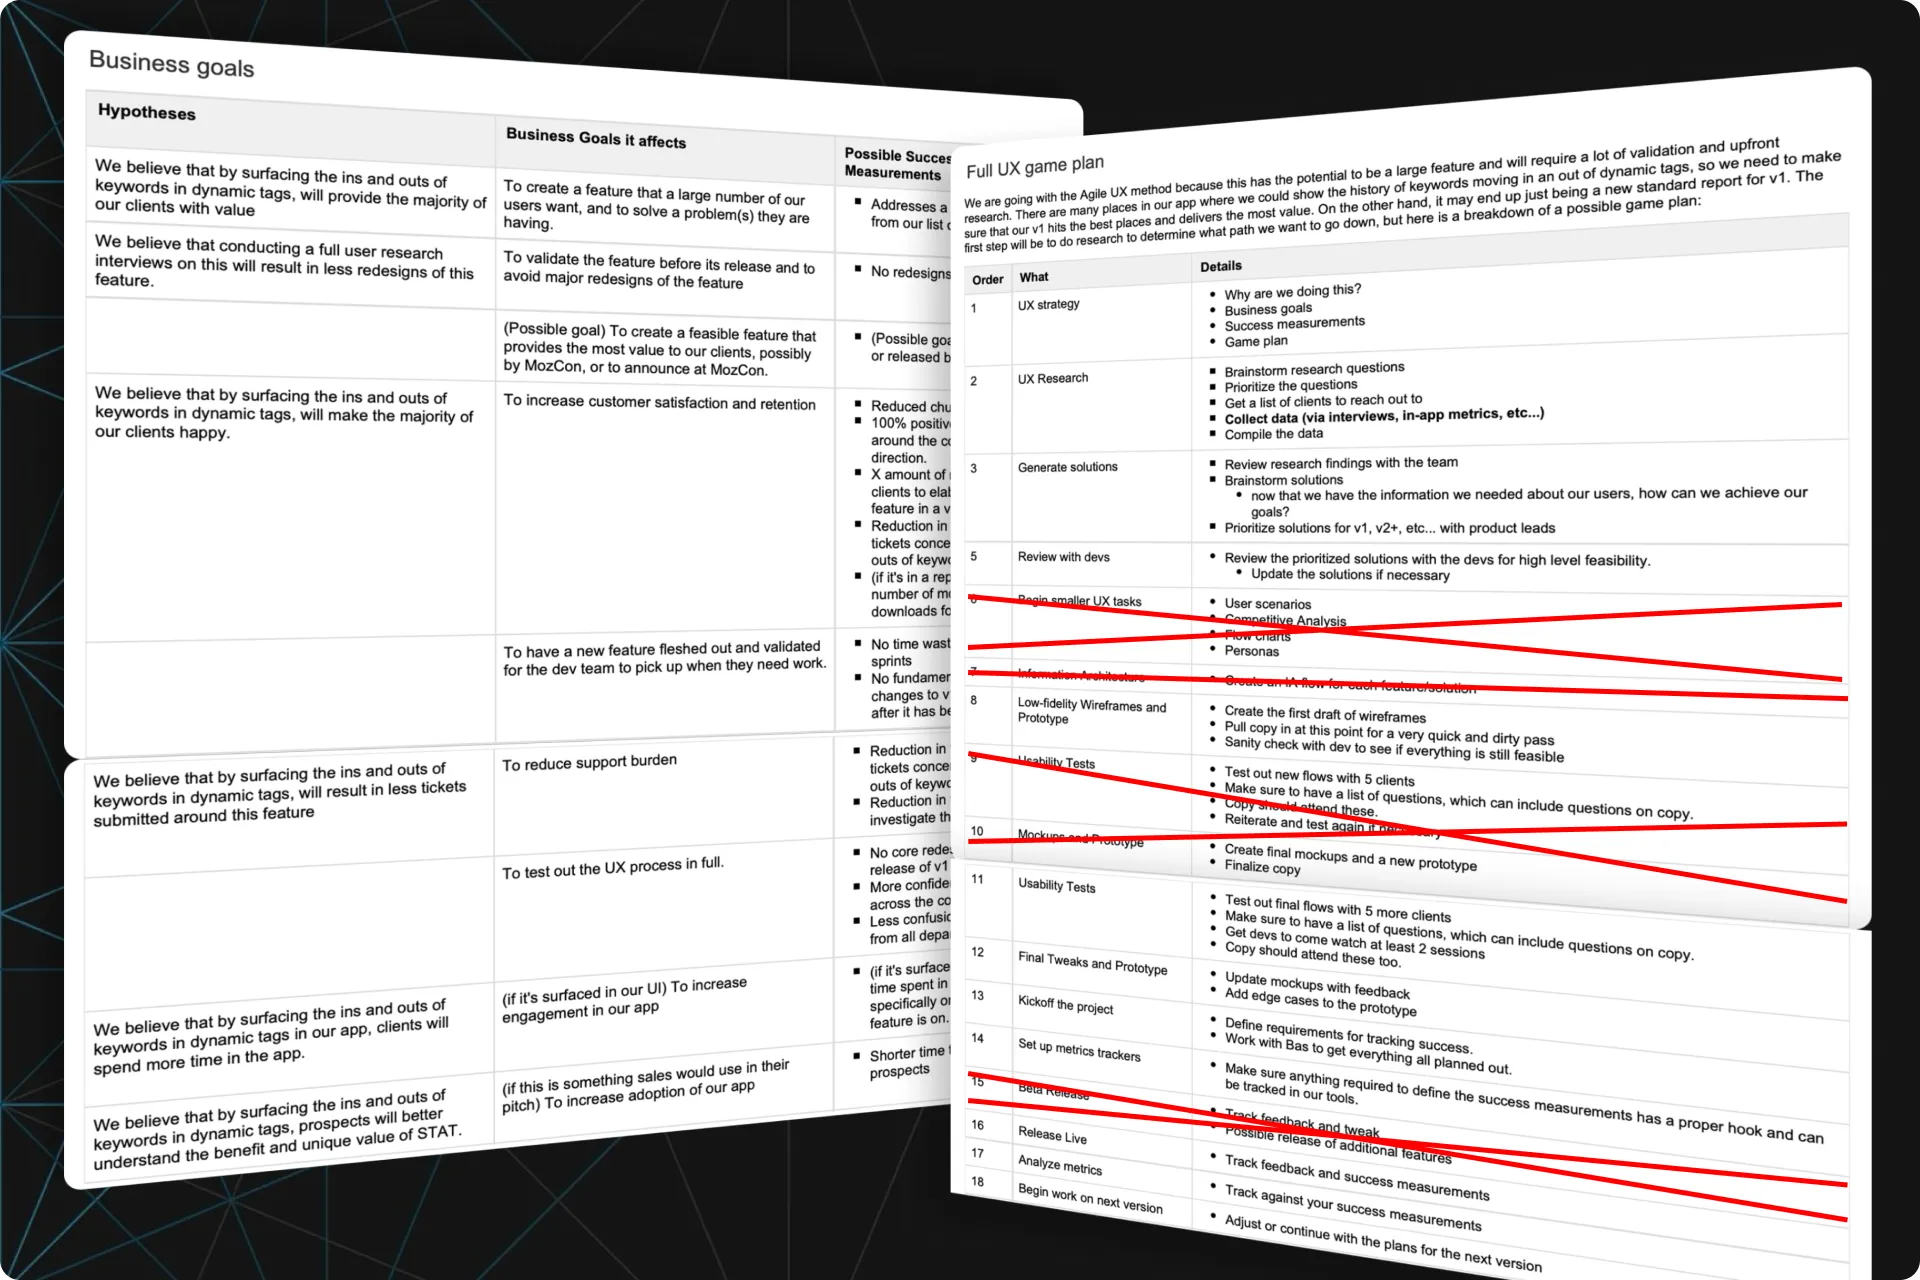
Updated the game plan
Now that we knew the outcome was going to be a report, we didn’t really need a few of the existing steps, so I revisited the strategy and cleaned it up.
This also gave me a more accurate estimate of the cost for this feature from the UX side, which would help with my ROI calculations.
Step 06
Calculated ROI
With the requirements created, I could now plug in some data to calculate the costs vs benefits.
I found that this should pay for itself within the first year of being released, and that’s just on costs saved with CS. This calculation did not include the indirect benefits such as:
- Increased retention or reduced churn
- It adds unique value to the platform
- CS can now spend an extra day a week on something else.
This was enough to prioritize the work and proceed.
Step 07
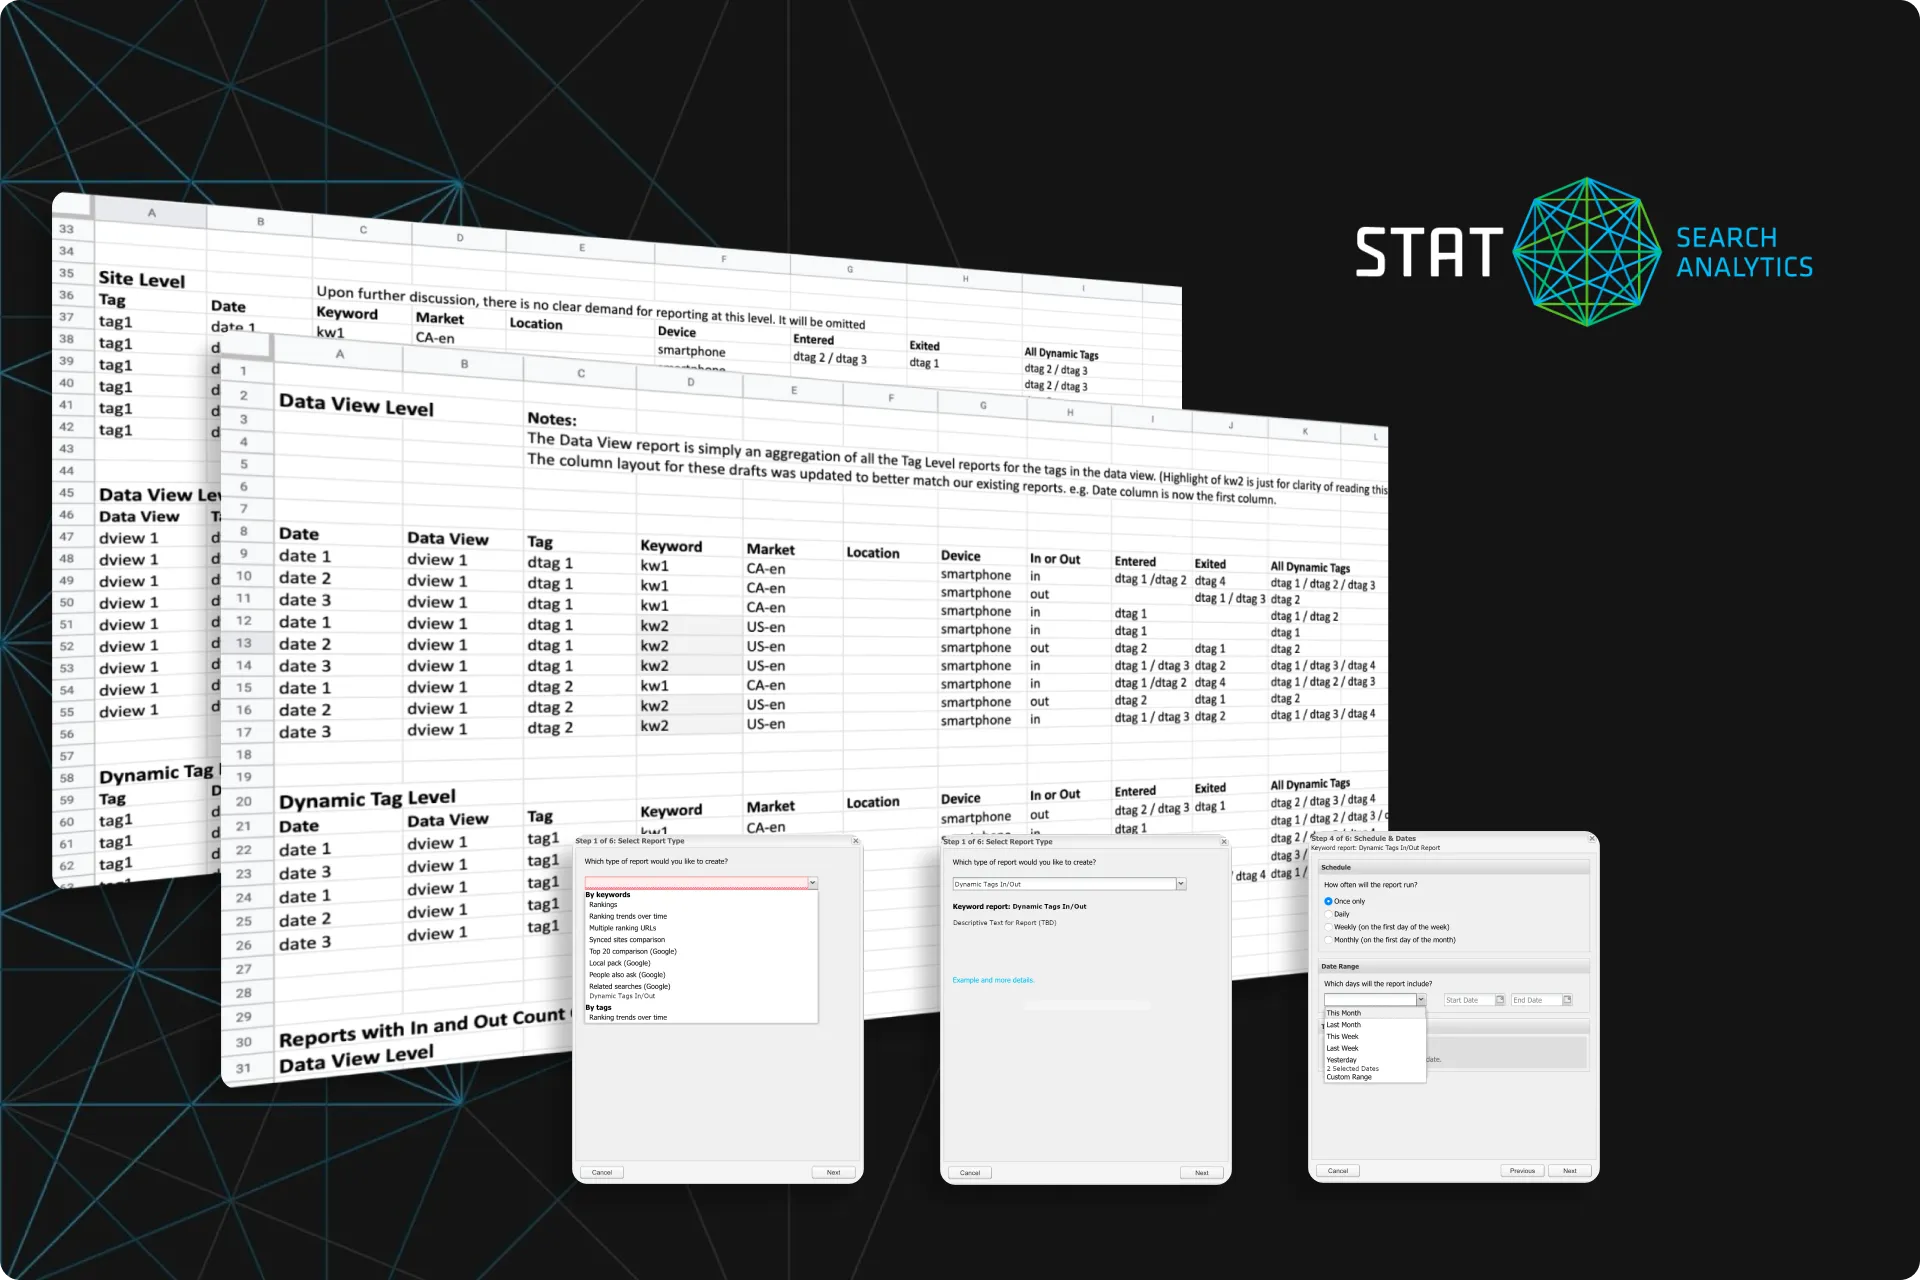
Wireframed and tested the report
We only needed wireframes and one round of usability tests in order to be confident in our direction. After that, it would be ready for dev as long as there were no game-changing insights from our tests.
We tested 8 participants, updating our wireframes when we agreed on issues that were obvious and crucial to the first release.
Step 06
Build. Release. Measure success.
Dev was able to put this together quickly and it was released with a plan to measure the outcome in 30 days and adjust if necessary.
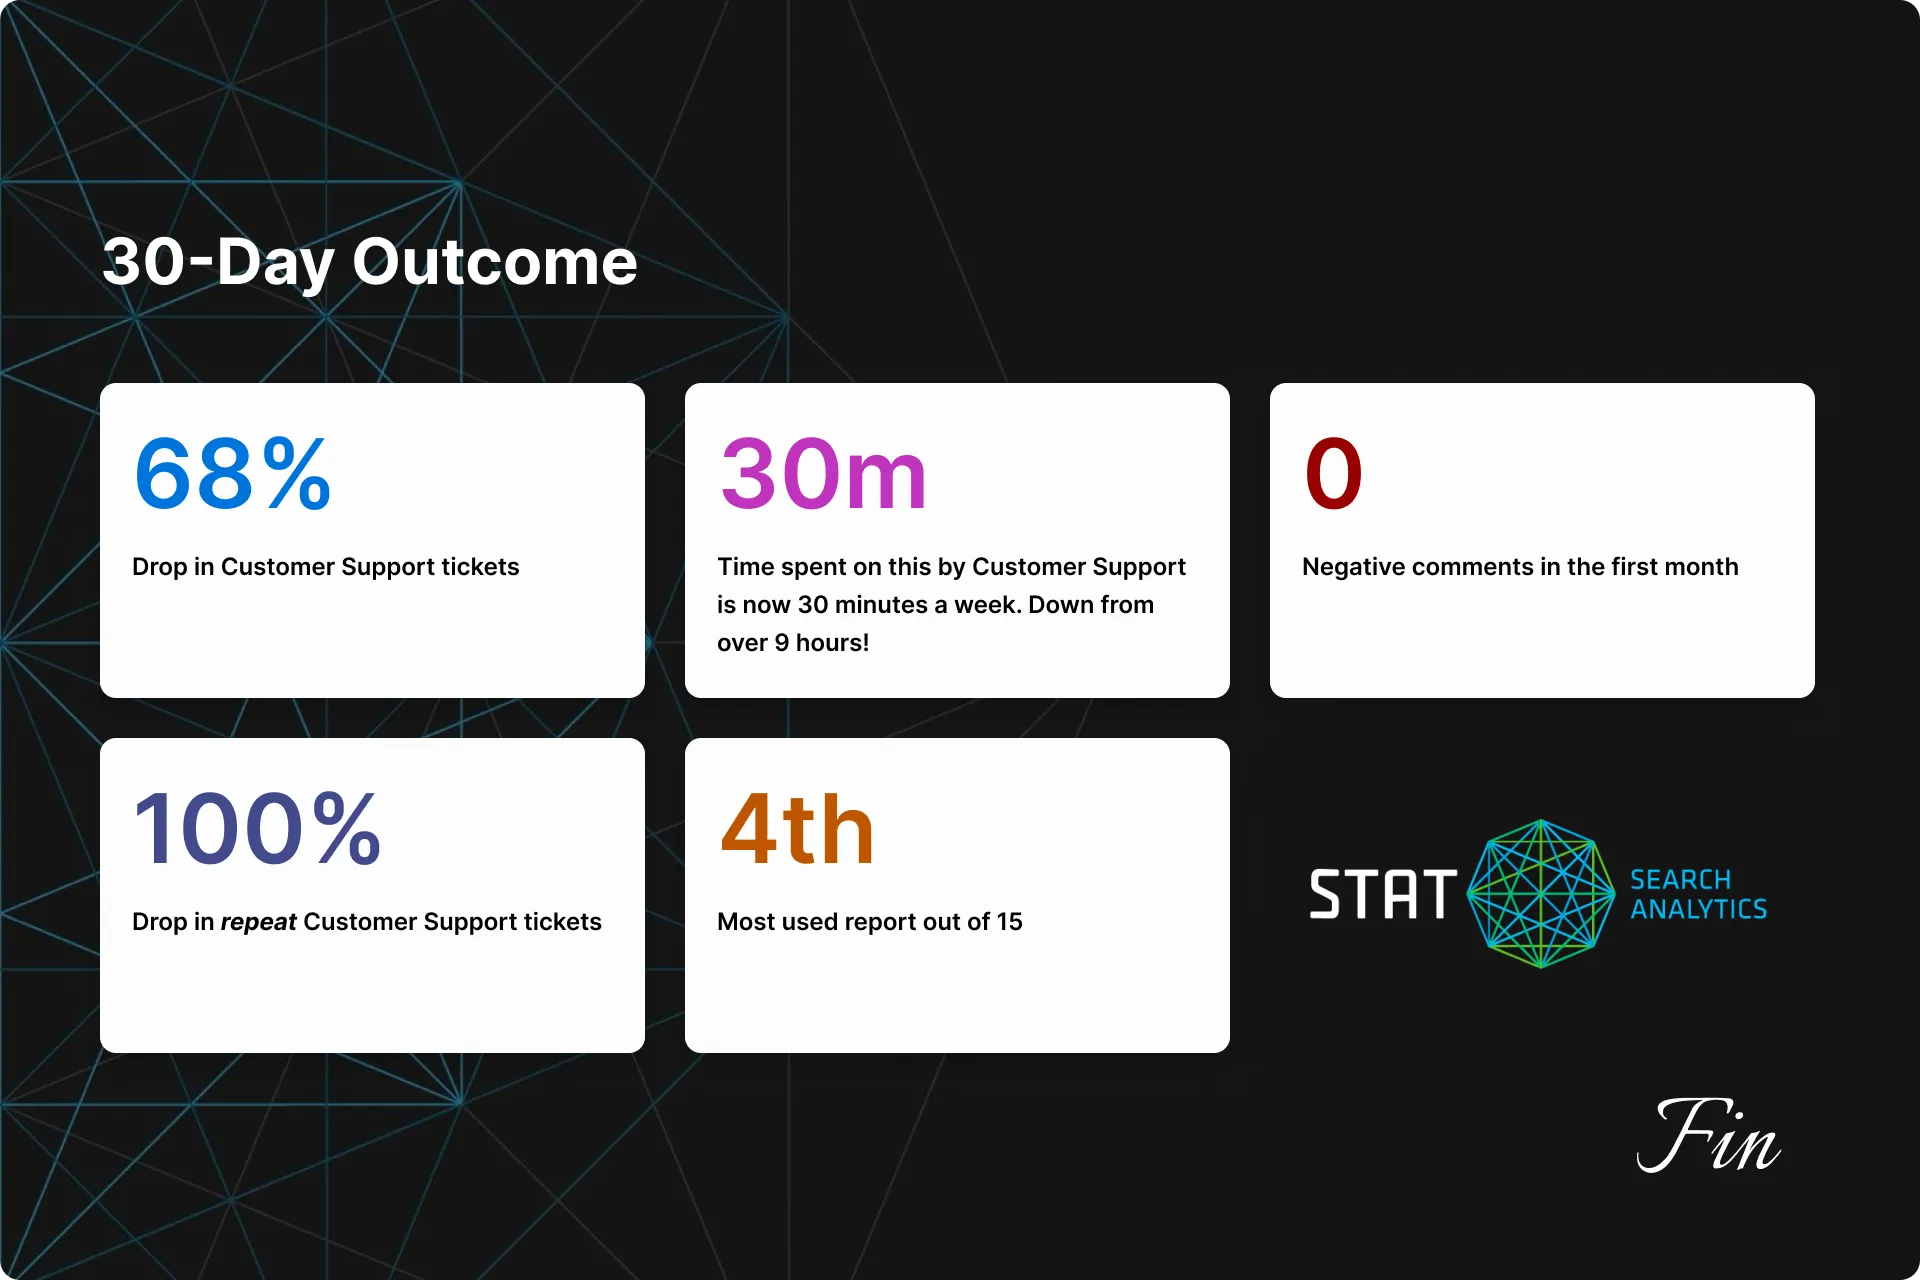
The Outcome
9.3 hours down to 30 minutes
After 30 days, I found:
- 68% drop in CS tickets concerning the ins and outs of keywords in a tag.
- 100% drop in repeat support tickets concerning this topic.
- This was our 4th most popular report, out of 15 reports.
- CS has “time spent” on these requests to under 30 minutes a week, down from 9.3 hours a week.